
Infographic - everything you need to know
A short introduction to the what, why and where of infographics.
Introduction
The popularity of the infographic has risen dramatically over the past few years. You see them everywhere, in your Facebook feed, the slides at the conference or the annual report. But is infographic just another buzzword, we'll forget about tomorrow? Before getting to this, let's take a look at what infographic really means.
Despite the popularity of infographic distribution, there's only a few articles covering the meaning behind this field of design. As an agency only working with infographics, we often get the question Can you create an infographic for us? Problem is that there's not really a mutual understanding of the term. Some refer to infographic as a specific format, some simply as an illustrated graph and some even as a specific graphic style. The confusion is understandable. A lot of the terms used in the field of information design (data visualizations, infographics, etc.) overlap, and therefore the concept of infographic is open to individual interpretation.
What is an infographic?
Actually the term infographic is just a portmanteau of information and graphic. According to Wikipedia infographics are graphic visual representations of information, data or knowledge intended to present information quickly and clearly. Is it really that simple? Yes and no. Yes, if you accept a simplified definition where infographics cover a wide range of visual formats, types of content, style and media. No, if you want to differentiate the term from other related fields of design.
An infographic will always consist of information; it can be anything from a survey, fact(s), a data set to an process. In other words, what you want choose to communicate. Both qualitative and quantitive information are valid. Then you transform the information into graphic elements (graphs, icons, illustrations, layout, copywriting, etc.). In other words, how you choose to communicate the information.
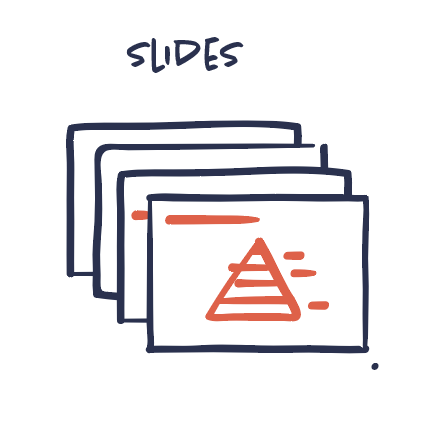
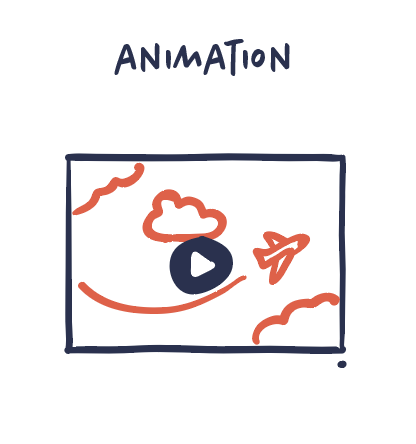
It's important to underline the fact that an infographic is not restricted to a single medium or type. Infographics come in all sizes, formats and styles and they can divided into three types: static, interactive and animated infographics.

Why infographic?
Infographic as a term might be new, but not as a concept. Communicating information visually has been around for many years. Nevertheless in recent years, we've seen an increase in both personal and professional use of visual communication such as infographics. There's a number of reasons for this tendency and arguments for why infographics are succesful. Basically it comes down to two major factors. First of all, we have more information and data to communicate. Actually, 90 percent of data in the world today has been created in the last two years - and this growth just seems to continue. At the same time it's harder get the message across to your audience who is exposed to information corresponding to 174 newspaper every single day. In other words your audience has less time and attention to your communication. The infographic may be your answer to this challenge.

When to use an infographic?
It may sound basically, nevertheless it's a common mistake among creating an infographic: it's an way of doing it, never a goal in itself. Always ask what's the purpose of the infographic. The goal of an infographic can be anything from creating an overview, attracting new clients, driving web traffic to convincing about the benefits of a product.
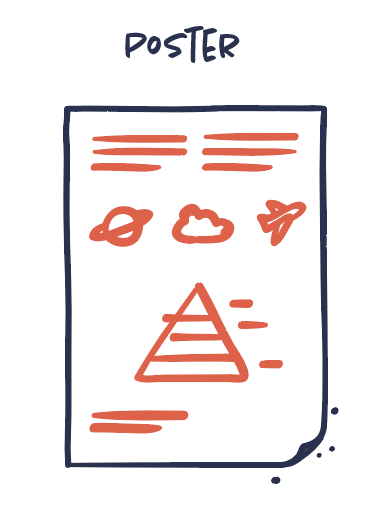
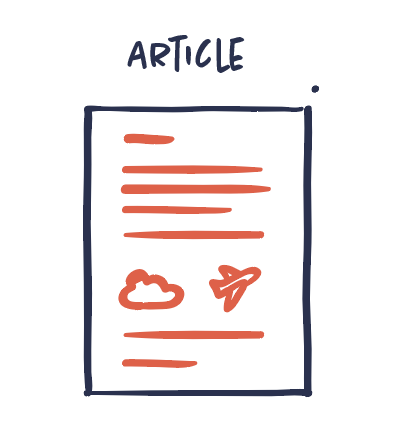
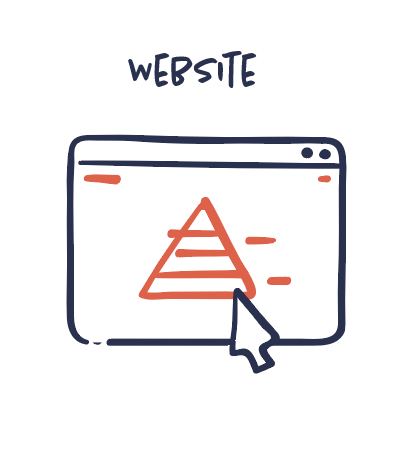
Where to use infographics?
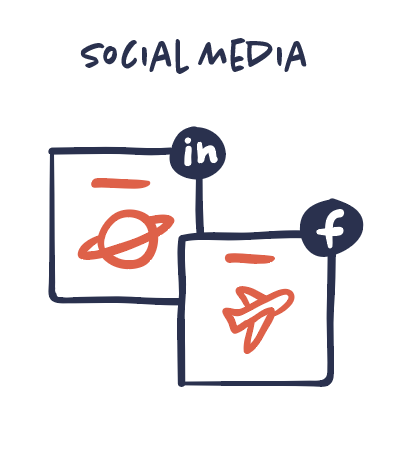
As earlier mentioned infographics are not limited to a specific medium, style or context. They come in all sizes and shapes, but it's important to adjust your infographic regarding the context, content, topic, target group, medium, etc. Often marketers distribute same infographic across different mediums. The story might be the same but it should be communicated very different.


The future of infographic?
Will the term infographic still be popular in the future? Probably not. Will the concept of infographic be popular in the future? Absolutely. As long as there's a need for communicating in a better, smarter and more efficient way visually. That being said we do believe that the understanding of infographic will continue to evolve over time. We've already seen a trend towards fewer but better infographics as a great indication of quality rather quantity.
Need more infographic inspiration?
In the interest of creating better infographics, here's a few links that might help you:
- Data Viz Project: Our very own project including the biggest archive of data visualizations. It guides in finding the right data viz type and includes thousands of great inspirational examples.
- Ferdio Learnings: Our very own collection of best-practice working with infographics wether you're an designer or marketer.
- Data Visualization: An introduction to data visualization and how it differs from infographics.
- Motion Graphics: An introduction to the motion graphics and how it's related to infographics.
And of course, if you need our help creating an infographic, please get in touch with us.